


×
![]()
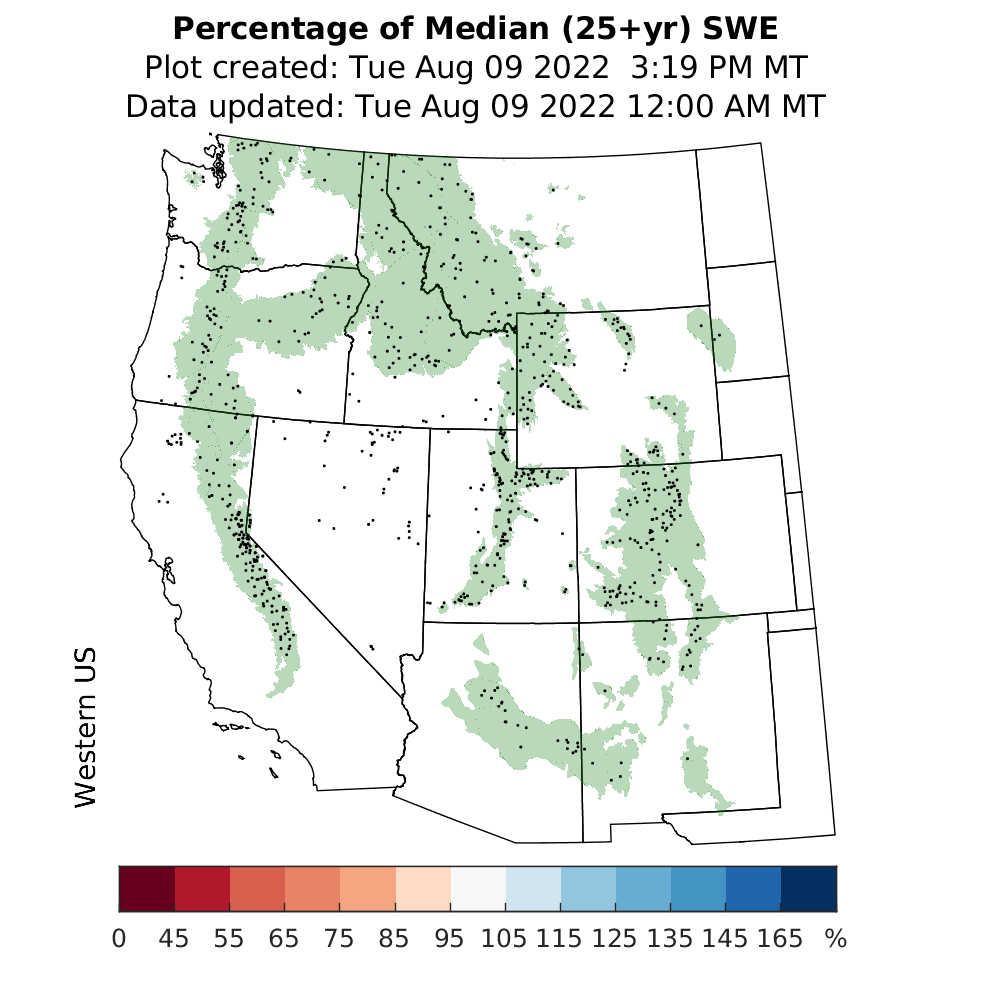
more Snow data/tools:
NRCS Interactive Map
- SNOTEL Current SWE % of median
- SNOTEL Current SWE percentiles
- SNOTEL Basinwide (HUC2) SWE % of median
CBRFC Modeled SWE (select “Grids” or “Model” from tabs on right; initial square icons are SNOTEL obs)
SnowView SWE tool (SWANN and SNODAS)
CWCB SNODAS tool (Colorado only)